
Matplotlib Basic: отображать сетку и рисовать линейные графики и настраивать линии сетки с рендерингом с большей сеткой (основная сетка) и меньшей сеткой (вспомогательная сетка). Включите сетку, но отключите галочки
Matplotlib Basic: упражнение 14 с решением
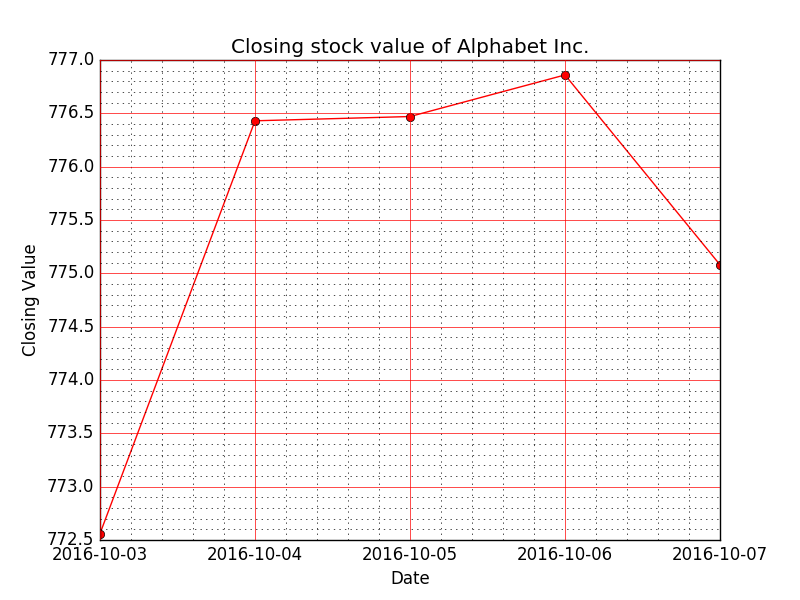
Напишите программу на Python для отображения сетки и нарисуйте линейные графики значения закрытия Alphabet Inc. в период с 3 октября 2016 года по 7 октября 2016 года. Настроил линии сетки с рендерингом с большей сеткой (основной сеткой) и меньшей сеткой ( мелкая сетка). Включите сетку, но выключите галочки ..
Дата, Закрыть
03-10-16,772.559998
04-10-16,776.429993
05-10-16,776.469971
06-10-16,776.859985
07-10-16,775.080017
Пример решения :
Код Python:
import datetime as DT
from matplotlib import pyplot as plt
from matplotlib.dates import date2num
data = [(DT.datetime.strptime('2016-10-03', "%Y-%m-%d"), 772.559998),
        (DT.datetime.strptime('2016-10-04', "%Y-%m-%d"), 776.429993),
        (DT.datetime.strptime('2016-10-05', "%Y-%m-%d"), 776.469971),
        (DT.datetime.strptime('2016-10-06', "%Y-%m-%d"), 776.859985),
        (DT.datetime.strptime('2016-10-07', "%Y-%m-%d"), 775.080017 )]
x = [date2num(date) for (date, value) in data]
y = [value for (date, value) in data]
fig = plt.figure()
graph = fig.add_subplot(111)
# Plot the data as a red line with round markers
graph.plot(x,y,'r-o')
# Set the xtick locations
graph.set_xticks(x)
# Set the xtick labels
graph.set_xticklabels(
        [date.strftime("%Y-%m-%d") for (date, value) in data]
        )
# naming the x axis
plt.xlabel('Date')
# naming the y axis
plt.ylabel('Closing Value')
# giving a title
plt.title('Closing stock value of Alphabet Inc.')
# Turn on the minor TICKS, which are required for the minor GRID
plt.minorticks_on()
# Customize the major grid
plt.grid(which='major', linestyle='-', linewidth='0.5', color='red')
# Customize the minor grid
plt.grid(which='minor', linestyle=':', linewidth='0.5', color='black')
# Turn off the display of all ticks.
plt.tick_params(which='both', # Options for both major and minor ticks
                top='off', # turn off top ticks
                left='off', # turn off left ticks
                right='off',  # turn off right ticks
                bottom='off') # turn off bottom ticks
plt.show()
Пример вывода:
Редактор кода Python:
Внесите свой код и комментарии через Disqus.
Предыдущий: Написать программу на Python для отображения сетки и рисовать линейные графики значения закрытия Alphabet Inc. в период с 3 октября 2016 года по 7 октября 2016 года. Настроить линии сетки с помощью styletyle -, width .5. и цвет синий.
Далее: написать программу на Python для создания нескольких графиков
Каков уровень сложности этого упражнения?
Новый контент: Composer: менеджер зависимостей для PHP , R программирования